 10 miesięcy temu

LONDON- The world’s busiest airline markets reveal London (LHR,LGW,LCY,STN,LTN,SEN) as the top contender, scheduling 216,969,485 seats over 12 months to July 2025.
Hartsfield-Jackson Atlanta International Airport (ATL) stands out as the world’s busiest single airport, though London’s combined capacity crowns it the global leader based on Cirium data.
This article ranks the top 23 markets, highlighting key cities and their total seat capacities. Insights into airport combinations and market definitions provide a deeper understanding of global air travel trends.
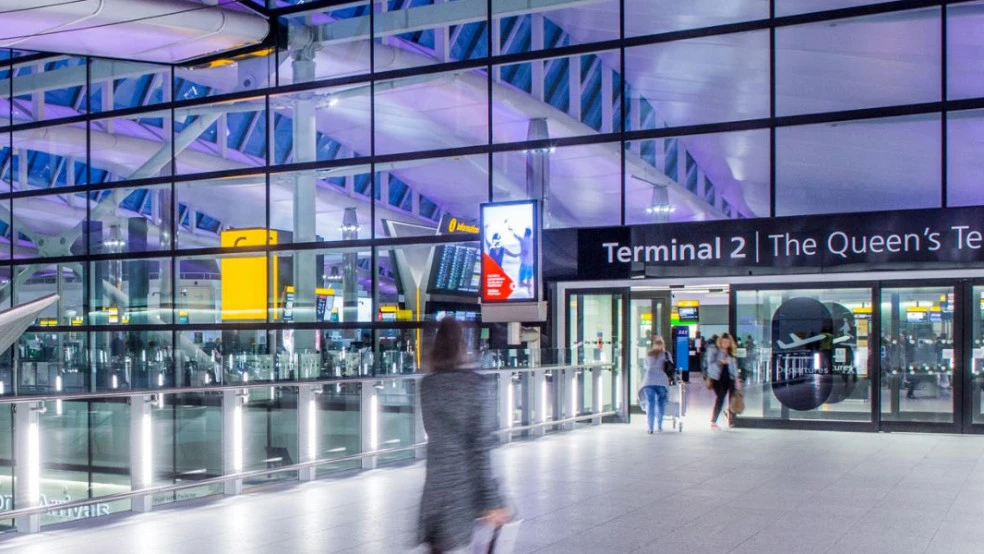 Photo: Skytrax
World’s Busiest Airline Markets
Here’s the complete list based on total scheduled airline seats to and from all airports in each metro area:
| 1 | London | LHR, LGW, LCY, STN, LTN, SEN | 216,969,485 | United Kingdom |
| 2 | New York | JFK, EWR, LGA | 175,423,364 | United States |
| 3 | Tokyo | HND, NRT | 158,732,795 | Japan |
| 4 | Shanghai | PVG, SHA | 154,675,866 | China |
| 5 | Beijing | PEK, PKX, NAY | 153,750,440 | China |
| 6 | Istanbul | IST, SAW | 152,945,752 | Turkey |
| 7 | Paris | CDG, ORY, BVA | 133,389,428 | France |
| 8 | Los Angeles | LAX, SNA, ONT, LGB, BUR | 128,273,787 | United States |
| 9 | Atlanta | ATL | 126,514,937 | United States |
| 10 | Dallas–Fort Worth | DFW, DAL | 125,929,450 | United States |
| 11 | Dubai | DXB, DWC | 123,016,844 | U.A.E. |
| 12 | Chicago | ORD, MDW | 122,580,334 | United States |
| 13 | Miami | MIA, FLL, PBI | 116,060,029 | United States |
| 14 | Bangkok | BKK, DMK | 115,978,258 | Thailand |
| 15 | Seoul | ICN, GMP | 108,851,565 | Korea |
| 16 | Chengdu | TFU, CTU | 106,452,540 | China |
| 17 | Baltimore/Wash. | BWI, IAD, DCA | 99,762,073 | United States |
| 18 | Denver | DEN | 98,333,430 | United States |
| 19 | Guangzhou | CAN | 96,569,225 | China |
| 20 | San Francisco | SFO, OAK, SJC | 92,859,342 | United States |
| 21 | Delhi | DEL | 91,211,540 | India |
| 22 | Sao Paulo | GRU, CGH, VCP | 88,108,861 | Brazil |
| 23 | Singapore | SIN | 85,044,075 | Singapore |
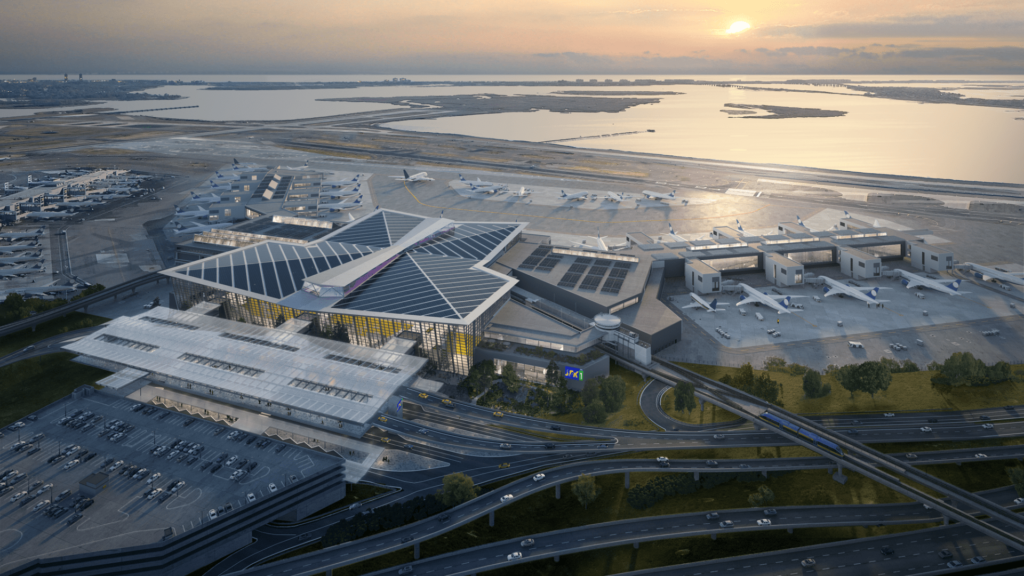 Photo: Ferrovial
Market Performance Analysis
The analysis identifies London, United Kingdom, as the world’s busiest airline market, with 216,969,485 total seats across six airports: Heathrow (LHR), Gatwick (LGW), London City (LCY), Stansted (STN), Luton (LTN), and Southend (SEN).
New York follows with 175,423,364 seats, combining John F. Kennedy (JFK), Newark (EWR), and LaGuardia (LGA) airports. Tokyo, Japan, ranks third with 158,732,795 seats, served by Haneda (HND) and Narita (NRT).
Shanghai, China, totals 154,675,866 seats across Pudong and Hongqiao, while Beijing in China records 153,750,440 seats with Peking (PEK), Daxing (PKX), and Nanyuan (NAY).
Istanbul (IST, SAW), Turkey, reaches 152,945,752 seats via Istanbul and Sabiha Gokcen. Paris (CDG, ORY, BVA), France, offers 133,389,428 seats across Charles de Gaulle, Orly, and Beauvais.
Los Angeles (LAX, SNA, ONT, LGB, BUR), United States, schedules 128,273,787 seats across five airports, including LAX and smaller regional hubs.
Atlanta (ATL), also in the US, records 126,514,937 seats, dominated by Hartsfield-Jackson, the world’s busiest single airport. Dallas-Fort Worth totals 125,929,450 seats, reflecting strong domestic connectivity.
Dubai (DXB, DWC), UAE, offers 123,016,844 seats, driven by Dubai International. Chicago (ORD, MDW), United States, reaches 122,580,303 seats with O’Hare and Midway.
Miami (MIA, FLL, PBI), US, totals 116,060,229 seats, including Fort Lauderdale and Palm Beach. Bangkok (BKK, DMK), Thailand, schedules 115,978,258 seats across Suvarnabhumi and Don Mueang.
Seoul (ICN, GMP), Korea, records 108,851,565 seats with Incheon and Gimpo. Chengdu (TFU, CTU), China, totals 106,452,540 seats.
Baltimore/Washington (BWI, IAD, DCA), U.S., reaches 99,762,073 seats across three airports. Denver (DEN), United States, offers 98,333,430 seats. Guangzhou (CAN), China, schedules 96,569,225 seats.
San Francisco (SFO, OAK, SJC), U.S., totals 92,859,342 seats with three airports. Delhi (DEL), India, records 91,211,540 seats. Sao Paulo (GRU, CGH, VCP), Brazil, offers 88,108,861 seats across three hubs. Singapore (SIN) concludes with 85,044,075 seats.
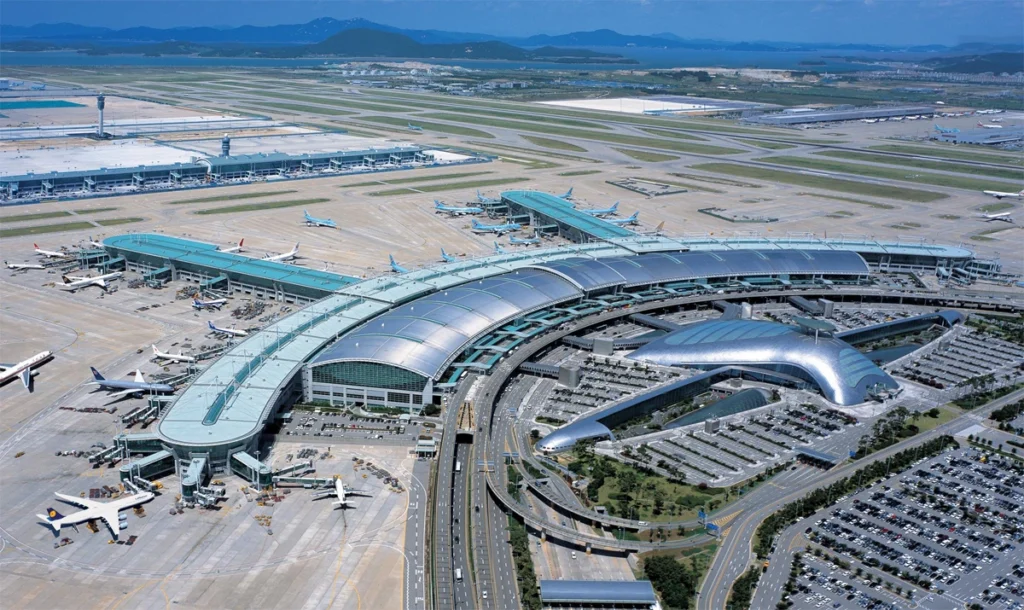 Incheon International Airport | Photo: Skytrax
Growing Economic Zones
London’s leadership, with 216,969,485 seats, underscores its status as a global economic and travel hub, influencing international trade and tourism.
The inclusion of smaller airports, like Southend or Palm Beach, highlights how market definitions shape rankings, as noted in the source’s subjective adjustments.
Atlanta’s 126,514,937 seats, driven by a single airport, suggest concentrated investment yields high throughput, impacting local economies.
Rising Asian markets, including Beijing and Seoul, reflect growing middle-class travel, boosting global airline revenues. Dubai’s 123,016,844 seats position it as a key transit point, enhancing Middle Eastern aviation.
The data, informs industry planning, guiding airport expansions and route development. Subjective airport combinations, like Miami with Palm Beach, raise questions about market boundaries, potentially affecting future analyses and investment decisions.
 Beijing Daxing International Airport; Photo- the Schindler Group
Methodology
The rankings rely on seat data from Cirium Diio, reflecting scheduled capacities to and from all area airports over 12 months to July 2025.
Combining airports, such as Miami with Palm Beach, involves subjective decisions, as noted by the source. This approach better approximates passenger totals, though it uses seat counts.
London’s dominance stems from its six airports, outpacing single-airport markets like Atlanta. The data will appear in Airline Weekly, offering further insights into global aviation trends.
Stay tuned with us. Further, follow us on social media for the latest updates.
Join us on Telegram Group for the Latest Aviation Updates. Subsequently, follow us on Google News
Top Busiest Airspace in the World in 2025
The post Top Busiest Airlines Markets in the World in 2025 appeared first on Aviation A2Z.