
These Were The Best And Worst Performing Assets Of June, Q2 And The First Half
Today was the start of the second half of the year, and Deutsche Bank’s thematic research team published its usual monthly performance review with this one covering June, Q2, and H1. We will go present the full version below, but first let’s take a look at some brief highlights (all USD) and additional comments:
-
It may surprise some that silver led the way (+22.5%) in the first half, with other metals like gold (+12.8%) and copper (+12.9%) also high up the list. WTI oil (+13.8%) ensured that hard commodities packed out the top end of the sample in H1.
-
The NASDAQ (+18.6% total return) and S&P 500 (+15.3%) had very good H1s powered by a +37.0% advance for the Mag-7 and a stunning +149.5% return for Nvidia. But the small-cap Russell 2000 only returned +1.7% in H1, and was down -3.3% in Q2.
-
French assets slumped in Q2 following the snap election announcement. For instance, the Franco-German 10yr spread widened by +29bps over Q2, the biggest quarterly jump since Q4 2011 during the sovereign debt crisis. OATs were the worst performer in H1 in this sample (-6.8% in USD terms). French spreads have tightened a handful of basis points this morning though, as the chance of an overall majority for Marine Le Pen’s Rassemblement National have been reduced (according to markets) by a slight under-performance vs. polls, and news that other candidates may drop out in areas where they can help keep the RN out. The slight under-performance for the RN might be skewed by record turnout in urban areas which are traditionally liberal bastions. Additionally, the probability of an RN government has slightly increased after yesterday which is contrary to the current market narrative.
-
As an interesting snippet on global inflation, agricultural commodities are continuing to fall back. Corn (-10.1%) was down for a 6th consecutive quarter in Q2, alongside declines for soybeans (-3.4%) and wheat (-1.2%). So potentially some relief on food prices ahead after a big increase over recent years.
-
The weakness in the Japanese Yen showed no sign of letting up, and it’s now been the worst-performing G10 currency in both Q1 and Q2.
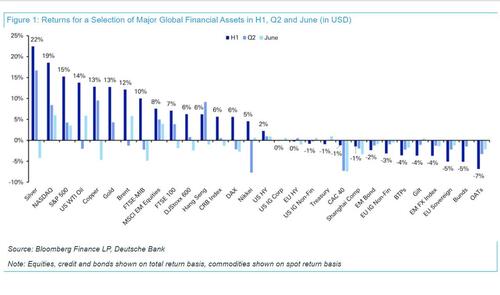
With the summary out of the way, here is a more extended look into the best and worst performing assets of the month, quarter and half.
Quarter in Review – The high-level macro overview
Markets got Q2 off to a pretty weak start. In April, there was growing concern about inflation, particularly after the US CPI report showed that core CPI was still running at +0.4% in March. That marked a third consecutive month when core CPI had been at +0.4%, raising fears that inflation was proving persistent. Moreover, geopolitical tensions were also heightened in the Middle East, and Iran launched a drone and missile attack on Israel on April 13, marking the first time there’d been a direct attack on Israel from Iran. Reports about a potential attack had already led to a selloff beforehand and on April 12, Brent crude oil prices peaked at their highs for the year above $92/bbl intraday. But as tensions eased and a further escalation didn’t occur, oil prices fell back again.
In May, markets put in a stronger performance, and the S&P 500 and the STOXX 600 both climbed to new records. That was supported by comments from Fed Chair Powell, who said that “I think it’s unlikely that the next policy rate move will be a hike.” So that eased concerns that monetary policy could be tightened further. US inflation also showed signs of easing, with core CPI slowing to +0.3% in the April data that was released in May. Alongside that, the geopolitical situation became calmer, and Brent crude oil prices fell back in May, after gains in the first four months of the year.
By June, rate cuts were increasingly in focus, and the ECB delivered their first rate cut since the pandemic, lowering their deposit rate by 25bps to 3.75%. The Bank of Canada also delivered their first rate cut of this cycle, meaning that 4 of the central banks with a G10 currency have now cut rates this year. Meanwhile in the US, the Fed didn’t cut rates in Q2, but the CPI release for May that was released in June showed the slowest monthly core CPI since August 2021. That helped to cement expectations that rate cuts were still on the horizon from the Federal Reserve, and at the June FOMC meeting, the median dot still pointed to one rate cut by the end of the year.
But despite the growing move towards rate cuts, sovereign bonds still struggled over Q2 as a whole, in part because investors were pricing in a more gradual cycle of rate cuts. For instance, at the end of Q1, 67bps of cuts were priced in by the Fed’s December meeting. But that was down to 44bps by the end of Q2. So sovereign bonds struggled to get much momentum, and the 10yr Treasury yield was up +20bps over the quarter to 4.40%.
Political developments were also back in focus from June, as the European Parliamentary elections took place at the start of the month. Significantly for markets, that then saw French President Macron announce that there would be a snap legislative election, with the first round taking place on June 30. That led to a notable selloff among French assets, and the Franco-German 10yr spread widened by +29bps in the week after the election announcement. That was the biggest weekly widening in the spread since the sovereign debt crisis in 2011. Moreover, the CAC 40 saw its worst weekly performance since March 2022. Over Q2 as a whole, the CAC 40 (-6.6%) saw its worst quarterly performance in two years, and the Franco-German 10yr spread widened by +29bps to 80bps. That is the biggest quarterly widening in the Franco-German 10yr spread since Q4 2011, when the Euro sovereign crisis was still ongoing.
Another theme of the quarter was the ongoing divergence between megacap stocks and the rest. For example, the Magnificent 7 was up by another +16.9% in Q2, which helped the S&P 500 to post a third consecutive quarterly gain of +4.3%. But there was weakness elsewhere, as the equal-weighted S&P 500 fell by -2.6%, and the small-cap Russell 2000 was down -3.3%. Meanwhile in Europe, the STOXX 600 was only up +1.6%, and in Japan, the Nikkei was also down -1.9%, after a very strong +21.6% gain in Q1.
Which assets saw the biggest gains in Q2?
-
The Magnificent 7 : It was a very strong quarter for the Magnificent 7, which rose +16.9% in total return terms. Nvidia (+36.7%) advanced for a 7th consecutive quarter.
-
Metals : It was generally a positive quarter for metals, with silver (+16.7%), platinum (+9.3%) and copper (+9.6%) all having their best performance in 6 quarters. Gold was also up +4.3% in its third consecutive quarterly gain.
Which assets saw the biggest losses in Q2?
-
French assets : The announcement of a snap election by Emmanuel Macron led to a selloff for French assets. For example, the CAC 40 fell -6.6% in total return terms, while French OATs fell -2.6%.
-
European sovereign bonds : Even though the ECB cut rates in June, investors moved to price in a more gradual pace of rate cuts over the months ahead, and sovereign bonds lost ground, including German bunds (-0.7%) and Italian BTPs (-1.5%).
-
Japanese Yen : The Japanese Yen was the worst-performing G10 currency in Q2, which was the second consecutive quarter that’s happened. It weakened by -5.9% to 161 per US Dollar.
-
Agricultural Commodities : The prices of several agricultural commodities continued to decline in Q2. That included corn (-10.1%), which fell for a 6th consecutive quarter, along with soybeans (-3.4%) and wheat (-1.2%).
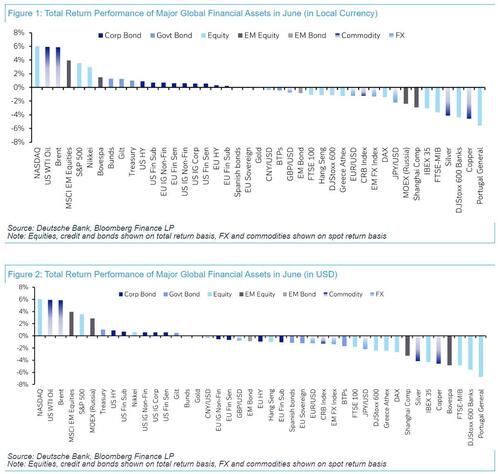
Finally hereare the best and worst performing assets in local currency and USD terms, in June…
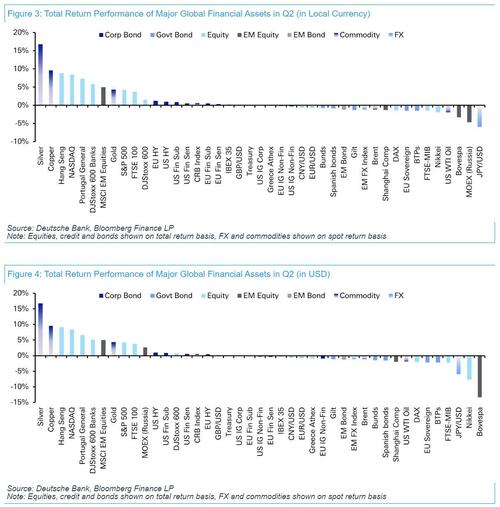
… in Q2…
… and in the first half.
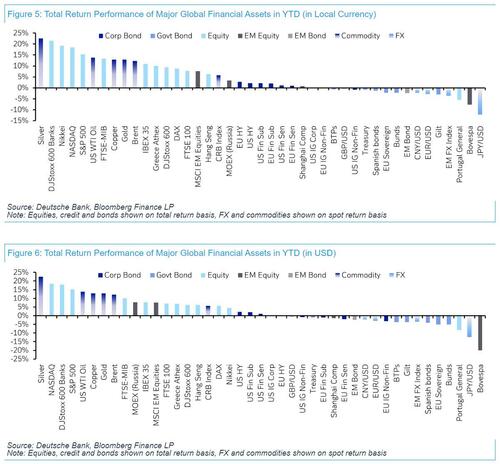
Source: DB, full note available to professional subscribers.
Tyler Durden
Mon, 07/01/2024 – 21:20

 1 rok temu




![Wytyczne w MOPS, żeby dawać jak najmniej zasiłków. Fałsz czy prawda? Na przykładzie zasiłku celowego 200 zł i zasiłku stałego dla stopnia umiarkowanego [List]](https://g.infor.pl/p/_files/37898000/shutterstock-2307730513-37897672.jpg)


