 1 rok temu

The One Chart That May Boost MAGA In 2026: End Of The Migrant Invasion
Goldman Sachs analysts Elsie Peng, David Mericle, Alec Phillips, and others published a note on Sunday titled „The End of the Immigration Surge,” outlining how President Trump’s border policies are ending the migrant border invasion that spiraled out of control under globalist rule via the Biden-Harris regime. The note highlights significant shifts in immigration policy and includes a key chart illustrating this end.
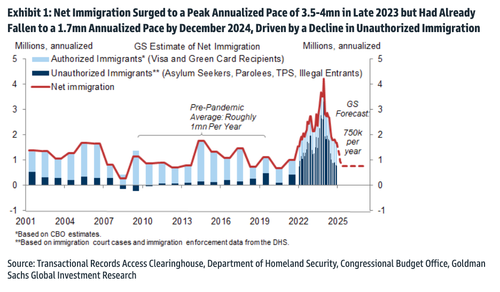
Net immigration surged above pre-pandemic levels between 2022 and 2024, peaking at an annualized rate of 3.5-4 million in late 2023 before sliding to about 1.7 million by December 2024, the analysts noted. This surge was largely due to open border policies and a complex network of taxpayer-funded NGOs that acted as conveyor belts, funneling migrants into the US, with industrial-size staffing companies domestically taking care of the logistics of bussing and flying the migrants around the country.
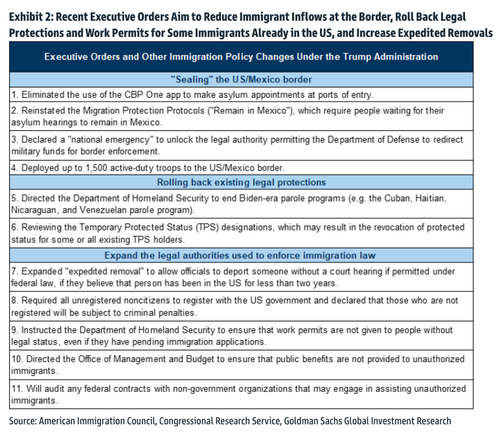
Peng and the analysts noted that Trump administration officials are attempting to reverse migration trends in three ways:
-
First, it has aimed to reduce new immigrant inflows by increasing border security, reinstating „Remain in Mexico,” and ending several humanitarian parole programs.
-
Second, it has sought to roll back legal protections for some immigrants already in the US, which could cause some to lose their work permits.
-
Third, it has sought to increase deportations.
Here are the latest executive orders Trump has signed to secure the border – all in an effort to restore national security.
On Truth Social, Trump already posted deportation success.
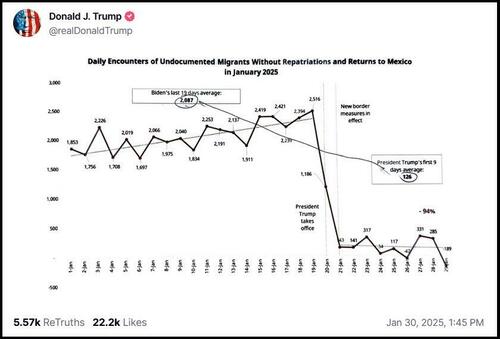 Screenshot, Truth Social
„We expect net immigration to slow further to 750k per year, well below the pace of the last three years but only moderately below the normal pre-pandemic pace,” the analysts noted, adding, „This would consist of 750k net authorized immigrants per year and zero net unauthorized immigrants, with roughly 500k deportations per year offsetting a similar number of asylum seekers and other entrants.”
Chart of the day…
Deportations are expected to run above average through 2028:
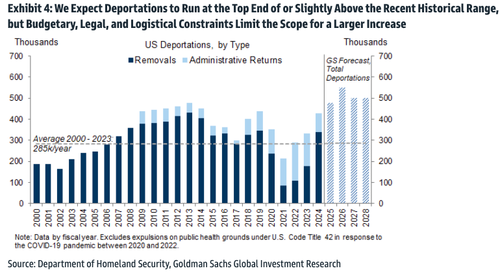
The macroeconomic impact of the deportations is expected to be limited. Migrant-driven labor force growth is forecasted to normalize in the first half of 2026, resulting in only a modest effect on GDP growth and inflation.
Here’s more from the analyst about the macroeconomic impacts of deportations:
-
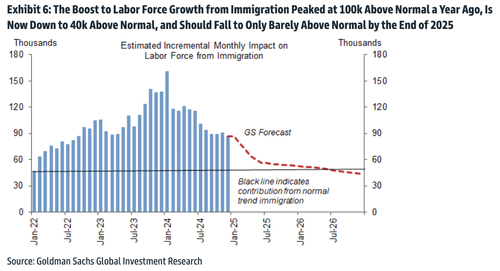
Under our baseline, the macroeconomic consequences of the immigration slowdown should be limited. The boost from immigration to labor force growth was 100k above normal at the peak, is about 40k above normal at present, and should return to normal by early 2026. The slower 750k per year pace of immigration would contribute 30-40bp less to potential GDP growth than the 2023-2024 pace but just 5bp less than the pre-pandemic pace. And the impact on wage growth and inflation should be modest now that the US labor market is back in balance.
-
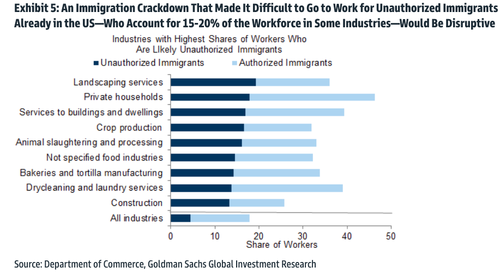
In a more extreme risk scenario where the immigration crackdown creates a climate in which unauthorized immigrants are afraid to go to work or employers are afraid to employ them, the economic consequences would be more serious because unauthorized immigrants already in the US account for 4-5% of the total workforce and 15-20% in some industries. Abruptly losing these workers could be very disruptive for many of these industries and have a larger inflation impact.
-
How will we know if the baseline or risk scenario is playing out? We can use both immigration and labor market data to monitor the latest developments. We construct real-time trackers of authorized immigration and of gross inflows and outflows of unauthorized immigrants using immigration court cases, data from government agencies, and daily arrest data. We have not yet seen dramatic changes since the election, though there is a roughly 1.5-month lag in these data.
-
Labor market data might prove more useful than immigration data in real time for monitoring the risk of workers staying home and avoiding workplaces or of large-scale voluntary departures. Specifically, we use the household survey micro data to track recent immigrants’ participation, unemployment, job-finding, and survey response rates, and use the establishment survey to track employment and average wages in industries that employ many unauthorized immigrants. While the job-finding rate has dipped recently, the other indicators have been fairly stable so far.
The industries where illegals are primarily working.
The migrant boost to the labor force is set to end by the end of this year.
The importance of the net migration graph will demonstrate to the American people that Trump’s border policies are fulfilling the mandates voters gave him to boost border security and restore national security—bolstering public confidence in MAGA ahead of the 2026 midterm elections.
Recall the graph that saved Trump’s life in the assassination attempt in Butler…
Trump: “As I was saying…” pointing to the graph on screen that he was speaking about nearly 3 months ago when a bullet ripped through his ear. pic.twitter.com/2nLVTejJQr
— WorldNetDaily (@worldnetdaily) October 5, 2024
Democrats have already started their 2026 campaign this week by yelling on the streets of DC that DOGE is causing a „constitutional crisis.” Dems are doubling and tripling down on woke and illegals in an era where their ability to control narratives dwindles – this is very dangerous for the party as the Overton Window has shifted from Marxist left to center-right.
Tyler Durden
Tue, 02/11/2025 – 16:40