 10 miesięcy temu

The Low Beta Boom: Sidestepping The Dotcom Bust
Authored by Michael Lebowitz via RealInvestmentAdvice.com,
Following the release of our article The High Beta Melt Up- Echoes of 1999, we received a few emails complaining that we left our readers hanging. They wanted to know how investors could have shifted their holdings from high beta and momentum stocks to sidestep massive losses when the dot-com bubble burst. In the first article, we mentioned that low beta stocks performed well during the bust, but we didn’t provide details.

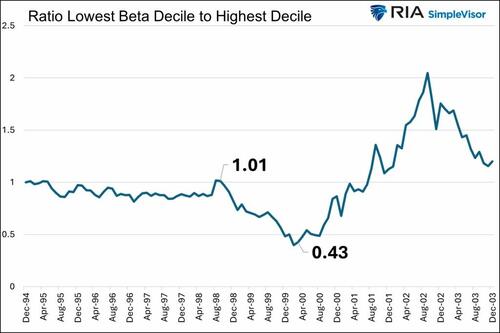
The first graph below from the article shows that shifting from high to low beta stocks at the end of the dotcom bubble (2000) would have been a brilliant move.
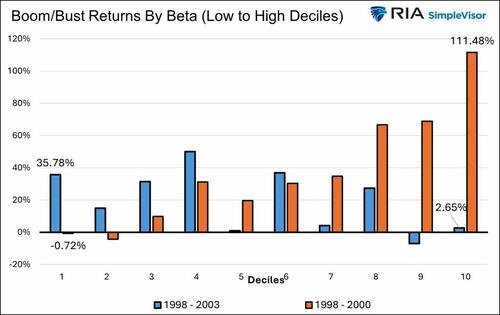
The second graph steps back and reveals that while low beta stocks were flat on average during the 1998-2000 boom, their return over the entire boom-bust cycle (1998-2003) was +35%. Conversely, the highest beta decile, which increased by 111% during the boom, earned a modest 2% return over the entire period.
Coaching A Portfolio
Managing a portfolio is like coaching a sports team. A coach needs to consistently assess the game environment and decide who sits and who plays. Equally important, they must be prepared to change players as the game evolves.
Similarly, as portfolio managers, we need to invest for today’s market while maintaining a plan for tomorrow. Accordingly, let’s look beyond high and low-beta stocks and examine how other stock factors performed during the dotcom boom-bust era. This will provide a roster of the types of stocks that may thrive if the current speculative melt-up melts down.
As we did in the original article, the monthly decile data is from Kenneth French and Dartmouth. Their database includes all stocks traded on the NYSE, Nasdaq, and the AMEX exchanges.
With that, we evaluate how some stock factors performed during the 1995-2003 market cycle.
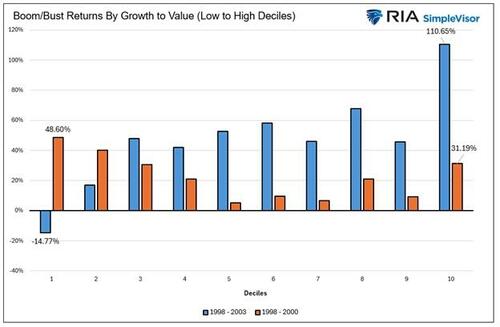
Growth Vs. Value
To determine what constitutes growth and value stocks, we use the traditional price-to-book value ratio. However, the French data computes the ratio in the reverse order, book to price. Thus, as we present below, the lower deciles are tilted toward growth-oriented stocks, while the higher deciles indicate more value-oriented stocks.
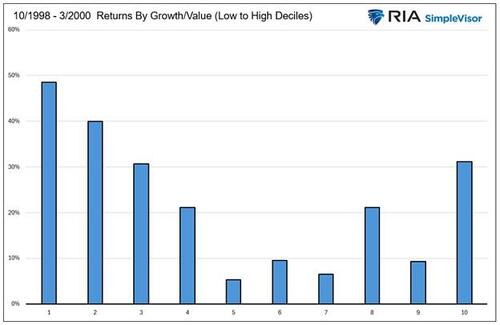
Like we saw with beta, in the rally leading up to the melt-up (1995-1998), both growth and value performed similarly. Also, like our beta analysis, and as we show below, the market leaned toward growth stocks at the expense of value stocks during the 1998-2000 boom. Interestingly, bucking the general trend, the highest decile of value stocks did much better than the lower deciles of value stocks.
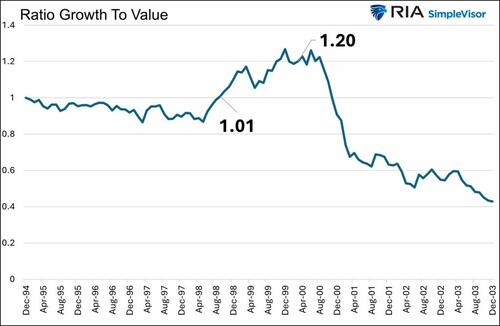
The following graph charts the price ratio of growth (lowest decile) to value (highest decile) through the entire cycle. Other than the melt-up from 1998-2000, the top decile of value stocks were clear outperformers versus the most growth-oriented stocks.
Lastly, the final chart shows that despite the underperformance during the boom, value investors who stuck with value stocks for the entire cycle fared much better than growth investors. However, the return differentials are much less evident for many of the deciles between the top and bottom. Thus, the data argue that deep value, not just value, was an investor preference during the period.
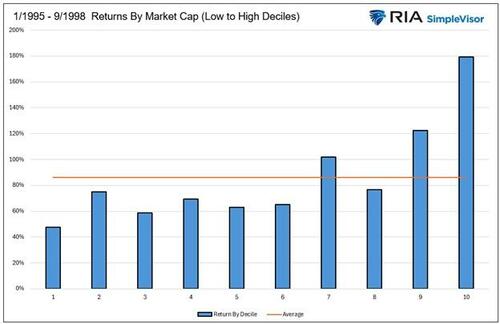
Market Cap
Next, we assess performance during the dotcom era using deciles of market capitalization. The lowest decile includes the smallest stocks, while the highest decile includes the largest.
This analysis of market cap is a little different than what we have calculated with beta and growth/value. In the pre-melt-up period, ranging from 1995 to October 1998, there was a large performance difference by market cap. The top decile of large-cap stocks grew by 180%, surpassing the small-cap deciles by over 100%.
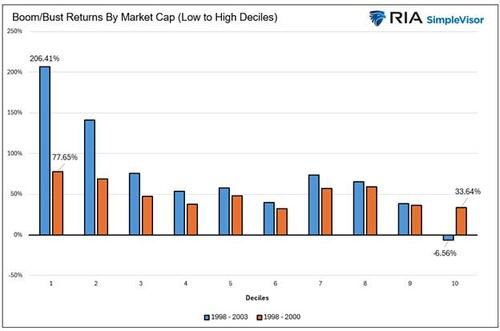
However, the lowest two deciles were the best performers during the melt-up from October 1998 to March 2000. Furthermore, after the market peaked, that sector’s performance continued to grow through the bust and recovery. As shown below, the lowest decile rose 77% during the dotcom boom and over 200% through the 1998-2003 cycle. The largest decile of market-cap stocks posted a slight loss for the cycle.
In the recent era covering 2023 until the 15% decline in April, i.e., the reign of the Magnificent Seven, the top decile by market cap increased by 51%, while the smallest decile by size declined by 14%.
As we show below the large cap S&P 500 (SPY) handily outperformed the small-cap Russell 1000 (IWM).
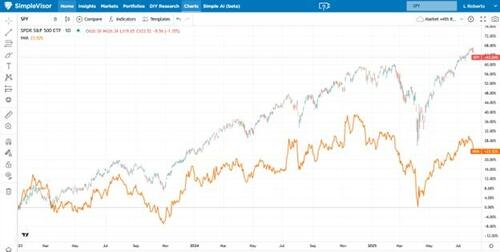
Will the current boom and eventual bust be the time to shift toward small companies?
Profitability
One of the recent themes, alongside high beta, that has emerged is profitability. Many of the stocks with the most impressive gains over the past three months have little to no profits. Similarly, the 1998-2000 boom was driven by stocks with poor profitability. At the time, investors were not concerned about current earnings. They were more captivated by potential future profitability.
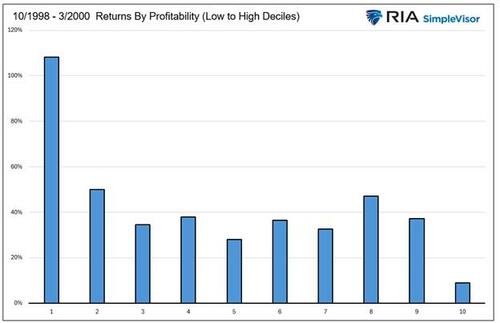
The graph below shows that from 1995 to 2003, the least profitable decile grossly underperformed the highest decile stocks. However, during the 1998-2000 boom, the least profitable companies took charge.
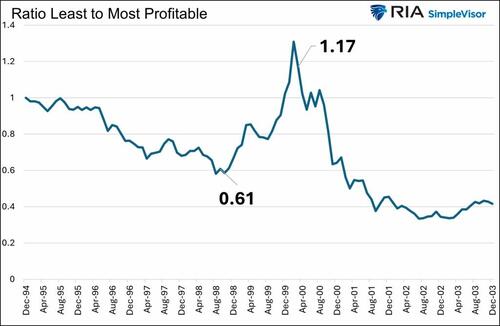
The lowest decile beat every other decile by at least 50%. This is highlighted in the second graph.
Despite the enormous gains from 1998 to 2000, the least profitable decile fell by 21% from 1998 to 2003. The highest decile was up 15% through the same period.
Review
Before looking at recent performance, let’s sum up our findings from the dotcom era.
-
Pre-boom persistent bullish trend (1995 to October 1998): the market preferred the largest and most highly profitable companies. It was relatively indifferent regarding beta and valuation.
-
Dotcom boom (October 1998 to March 2000): the market preferred stocks with the lowest profitability and highest betas. The other factors were mixed.
-
Dotcom bust (March 2000 through 2003), the market preferred higher profitability, low beta, smaller size, and value-oriented companies.
Today’s Potential Boom And Tomorrow’s Bust
The table below shows which factors were favored or out of favor during the bullish trend leading up to the tariff-induced decline and during the recent recovery. As shown, growth, large market cap, and high profitability were preferred before April. Not surprisingly, those traits characterize the Magnificent Seven. However, since the April lows, high beta and low profitability have been driving the market.
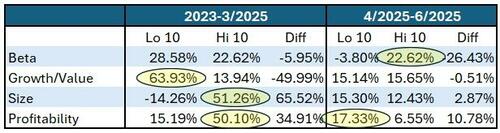
As a reminder, during the run-up to the 1998-2000 dot-com boom, the market favored large and profitable companies. Similarly, during the boom, low profitability and high beta were preferred.
If this current highly speculative trend continues into bubble territory like the dot-com era, we should consider that the winners and losers of a possible coming crash could share similar characteristics to those that outperformed during the dot-com bust. If so, smaller, low-beta, value-focused stocks with high profitability are likely to perform well.
Summary
Investor behaviors and preferences during the dotcom boom-bust and the current environment are similar. It’s too early to label the recent speculative activity as a boom on the same scale as the late 1990s. If a correction happens today, the fallout would probably be much smaller than what occurred 25 years ago.
However, if this speculative desire for high beta and lower profitability continues, we should consider gathering a list of stock factors and stocks that can help us grow our wealth as the broader markets and more speculative stocks correct themselves.
Tyler Durden
Wed, 08/06/2025 – 12:05


![Za dwa tygodnie bezsens w ZUS i WZON. Chodzę tam z opiekunem, bo po schodach wyglądam jak wyczerpany himalaista, którego każdy krok waży [świadczenie wspierające]](https://webp-konwerter.incdn.pl/eyJmIjoiaHR0cHM6Ly9nLmluZm9yLn/BsL3AvX2ZpbGVzLzM3ODgwMDAwL3No/dXR0ZXJzdG9jay03MjM2Nzk1NDMtMS/0zNzg4MDMzMC5qcGciLCJ3IjoxMjAwfQ.webp)


![Kapitalny zwrot akcji w finale! Legia Warszawa blisko tytułu [WIDEO]](https://i.iplsc.com/-/000MXW3909APPEU4-C461.jpg)