 1 rok temu

SYDNEY- Qantas (QF) remains a dominant force in Australian aviation, leveraging a diverse fleet and an extensive route network. The airline operates both short-haul and long-haul services, catering to millions of passengers annually.
This AvBench analysis examines Qantas’ top performing routes, its fleet composition, commercial and operational performance, and future opportunities.
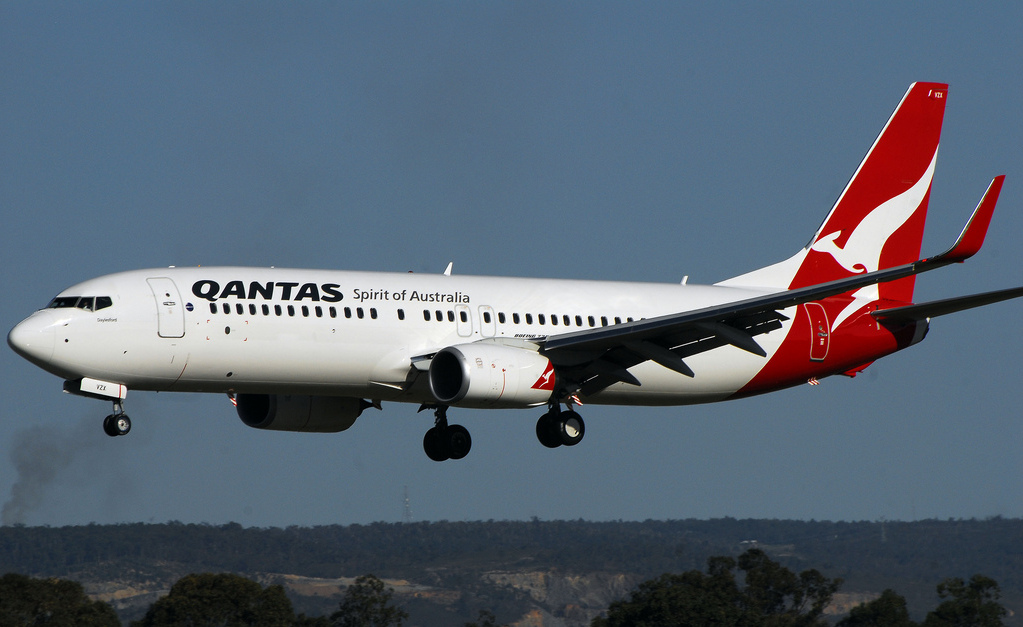 Photo: By Jordan Vuong from Perth, Australia – Qantas 737-800 short final, CC BY 2.0, https://commons.wikimedia.org/w/index.php?curid=24201981
Short and Medium-Haul Network Performance
Qantas (QF) operates a significant short and medium-haul network, carrying 21 million passengers annually, which represents 42% of its total available seat kilometers (ASK). Over the past 12 months, ticket revenue from these routes exceeded $4.6 billion.
The airline remains a leader in Australia’s domestic market and maintains a strong presence in trans-Tasman routes to New Zealand.
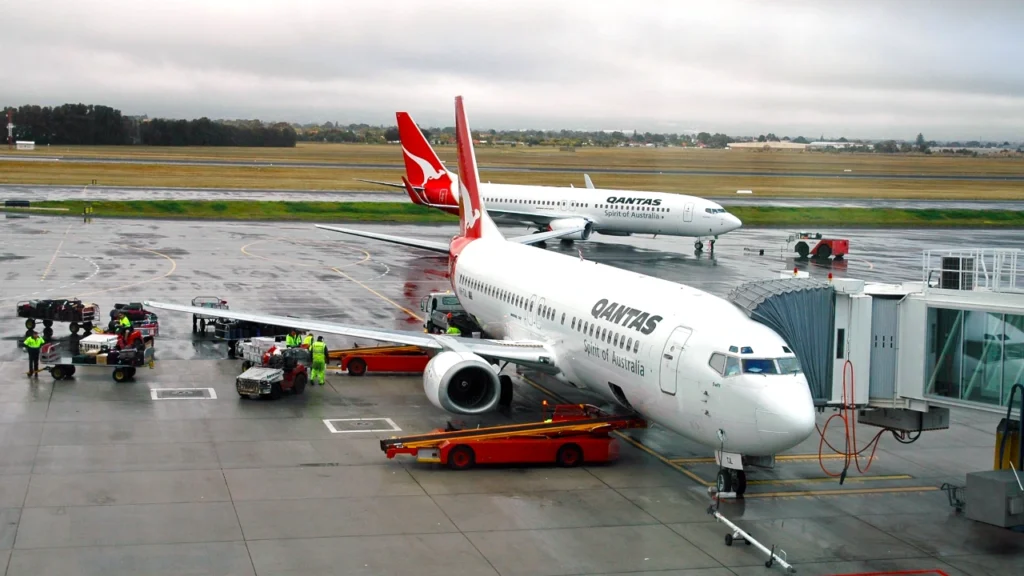 Photo: James St. John | Flickr
Qantas Top 30 Short/Medium-Haul Routes
The table below highlights Qantas’ top 30 short/medium-haul routes based on ASK and market performance.
| Melbourne – Sydney | 5.2 | 2,470k (+135k) | 3,027k (+41k) | 36% (-1%) | 36% (-1%) |
| Brisbane – Sydney | 5.6 | 1,115k (+75k) | 1,730k (+35k) | 41% (+1%) | 40% (+1%) |
| Adelaide – Melbourne | 5.9 | 586k (+46k) | 921k (+70k) | 37% (+2%) | 28% (-5%) |
| Sydney – Gold Coast | 5.7 | 228k (+24k) | 346k (+53k) | 14% (+2%) | 14% (+1%) |
| Auckland – Sydney | 5.1 | 168k (-19k) | 531k (+27k) | 38% (+1%) | 33% (+1%) |
| Perth – Sydney | 4.3 | 528k (-37k) | 814k (-48k) | 52% (-4%) | 46% (-10%) |
| Brisbane – Melbourne | 5.6 | 909k (+50k) | 1,227k (+47k) | 36% (0%) | 34% (-2%) |
| Melbourne – Perth | 4.4 | 646k (-7k) | 957k (-30k) | 46% (-6%) | 36% (-16%) |
| Adelaide – Sydney | 5.2 | 498k (+33k) | 793k (+54k) | 41% (-3%) | 34% (-8%) |
| Perth – Port Hedland | 4.5 | 280k (-1k) | 334k (+9k) | 72% (-4%) | 73% (-1%) |
| Sydney – Wellington | 4.4 | 49k (-1k) | 206k (+10k) | 69% (+2%) | 67% (+1%) |
| Gold Coast – Sydney | 5.7 | 228k (+24k) | 346k (+53k) | 14% (+2%) | 14% (+1%) |
| Broome – Perth | 4.7 | 159k (-18k) | 222k (-10k) | 63% (-1%) | 64% (+2%) |
| Brisbane – Cairns | 2.8 | 239k (-11k) | 250k (-90k) | 20% (-9%) | 32% (-6%) |
| Melbourne – Wellington | 3.8 | 49k (-1k) | 109k (+1k) | 57% (-4%) | 55% (-3%) |
| Brisbane – Christchurch | 3.9 | 54k (+1k) | 102k (+2k) | 47% (-2%) | 47% (+0%) |
| Brisbane – Darwin | 4.0 | 74k (-15k) | 53k (-44k) | 18% (-13%) | 33% (-8%) |
| Cairns – Sydney | 3.4 | 115k (-15k) | 171k (-21k) | 19% (-4%) | 15% (-7%) |
| Paraburdoo – Perth | 4.9 | 284k (-5k) | 328k (+17k) | 100% (0%) | 97% (0%) |
| Perth – Newman | 4.4 | 190k (-31k) | 237k (-15k) | 67% (-3%) | 68% (-1%) |
 Photo: By Bidgee – Own work, CC BY-SA 3.0, https://commons.wikimedia.org/w/index.php?curid=72800554
Fleet Composition and Opportunities
Qantas deploys a variety of aircraft for its short-haul operations, ensuring optimal capacity and operational efficiency:
- Boeing 737-800: 75 in service, highly profitable, despite increasing competition from Jetstar and Virgin Australia.
- Embraer E190: 32 in service, benefiting from Virgin Australia’s Fokker 100 retirements, allowing Qantas to maintain strong regional margins.
- Dash8-400: 31 in service, benefiting from competitor issues, with sustained strong market presence.
- Airbus A220-300: 4 in service, with 25 on order, showing early promising performance.
The A220’s introduction is seen as a major step toward fleet modernization, and its compatibility with QantasLink operations enhances its appeal.
The 737-800 remains a core fleet type, though increasing pressure from Jetstar’s A320 and A321neo fleets presents a long-term challenge.
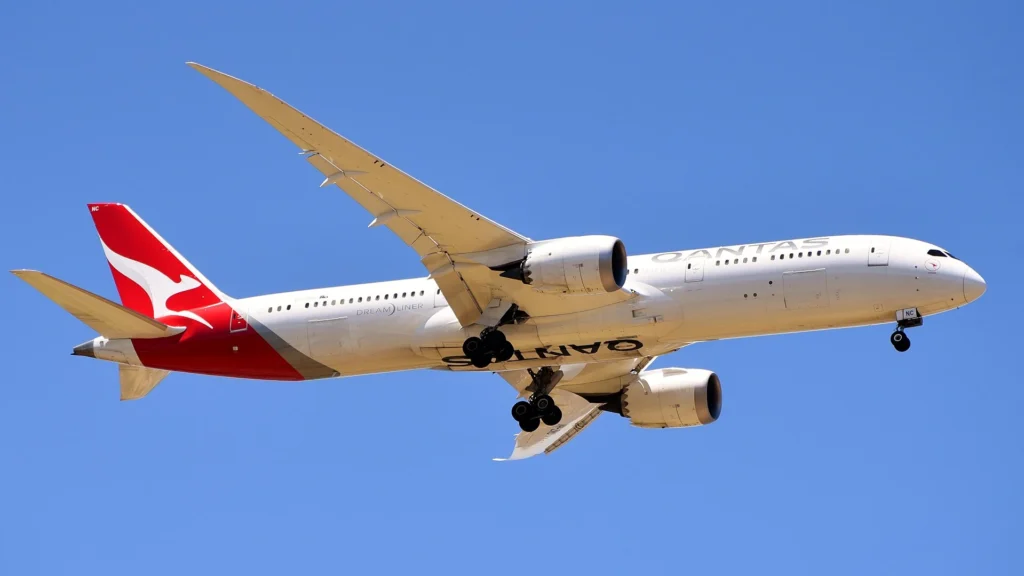 Photo: By Bahnfrend – Own work, CC BY-SA 4.0, https://commons.wikimedia.org/w/index.php?curid=86003593
Long-Haul Network Performance
Qantas’ long-haul network is experiencing strong growth, carrying approximately 5 million passengers annually and accounting for 58% of total ASK.
Ticket revenue over the past year was estimated at $4 billion. The airline competes in key intercontinental markets, with notable expansion in Asia-Pacific and North America.
Qantas Top 30 Long Haul Routes
The table below highlights Qantas’ top 30 long-haul routes based on ASK and market performance.
| Sydney – Tokyo | 6.7 | 138k (+80k) | 318k (+153k) | 44% (+11%) | 37% (+5%) |
| Hong Kong – Melbourne | 6.4 | 91k (+71k) | 161k (+135k) | 25% (+19%) | 24% (+18%) |
| Auckland – New York | 6.3 | 14k (+11k) | 74k (+56k) | 55% (+32%) | 51% (+32%) |
| Brisbane – Tokyo | 6.1 | 111k (+72k) | 155k (+95k) | 46% (-54%) | 43% (-57%) |
| Los Angeles – Sydney | 4.7 | 81k (+14k) | 308k (+19k) | 35% (-1%) | 34% (-1%) |
| Singapore – Sydney | 3.3 | 111k (+12k) | 413k (-20k) | 23% (-2%) | 24% (-1%) |
| Melbourne – Singapore | 5.8 | 81k (+21k) | 310k (+123k) | 18% (+5%) | 16% (+3%) |
| London – Singapore | 3.7 | 120k (+9k) | 312k (+3k) | 19% (-1%) | 18% (0%) |
| Brisbane – Los Angeles | 4.6 | 38k (+4k) | 136k (-12k) | 93% (-7%) | 91% (-9%) |
| Hong Kong – Sydney | 6.2 | 106k (+54k) | 190k (+72k) | 23% (+0%) | 23% (+2%) |
| Dallas – Sydney | 4.3 | 12k (0k) | 118k (-1k) | 100% (+0%) | 100% (0%) |
| Bangkok – Sydney | 3.4 | 46k (+4k) | 151k (-15k) | 30% (-9%) | 28% (-1%) |
| Santiago – Sydney | 5.8 | 15k (+2k) | 89k (+17k) | 100% (+0%) | 100% (0%) |
| Brisbane – Singapore | 4.4 | 35k (+7k) | 142k (+18k) | 22% (+1%) | 25% (+1%) |
| Honolulu – Sydney | 4.3 | 69k (-11k) | 118k (-18k) | 35% (-5%) | 35% (-4%) |
| Dallas – Melbourne | 5.6 | 10k (0k) | 67k (+14k) | 100% (+0%) | 100% (0%) |
| Jakarta – Sydney | 4.5 | 50k (+9k) | 135k (+2k) | 62% (-8%) | 60% (-10%) |
| Johannesburg – Sydney | 5.2 | 16k (0k) | 106k (-8k) | 100% (+0%) | 100% (0%) |
| Manila – Sydney | 4.8 | 39k (+8k) | 158k (-4k) | 35% (-5%) | 32% (-1%) |
| San Francisco – Sydney | 6.4 | 20k (+11k) | 57k (+35k) | 16% (+8%) | 13% (+4%) |
| Sydney – Vancouver | 5.4 | 14k (+2k) | 55k (+2k) | 22% (+1%) | 17% (-6%) |
| Perth – Rome | 5.1 | 7k (+2k) | 18k (0k) | 100% (+0%) | 100% (0%) |
| Perth – Singapore | 3.5 | 56k (-3k) | 181k (+12k) | 15% (-2%) | 11% (-5%) |
| Delhi – Melbourne | 5.1 | 40k (+8k) | 77k (-3k) | 32% (-1%) | 28% (-5%) |
| Shanghai – Sydney | 6.6 | 44k (+43k) | 84k (+83k) | 21% (+21%) | 22% (+12%) |
| Brisbane – Tokyo | 6.1 | 111k (+72k) | 155k (+95k) | 46% (-54%) | 43% (-57%) |
| Denpasar-Bali – Sydney | 4.9 | 68k (+1k) | 148k (+37k) | 19% (+2%) | 20% (+3%) |
| Jakarta – Melbourne | 5.1 | 42k (+3k) | 57k (+32k) | 42% (+7%) | 41% (+7%) |
| Denpasar-Bali – Melbourne | 3.3 | 106k (+4k) | 71k (-35k) | 8% (-4%) | 9% (-3%) |
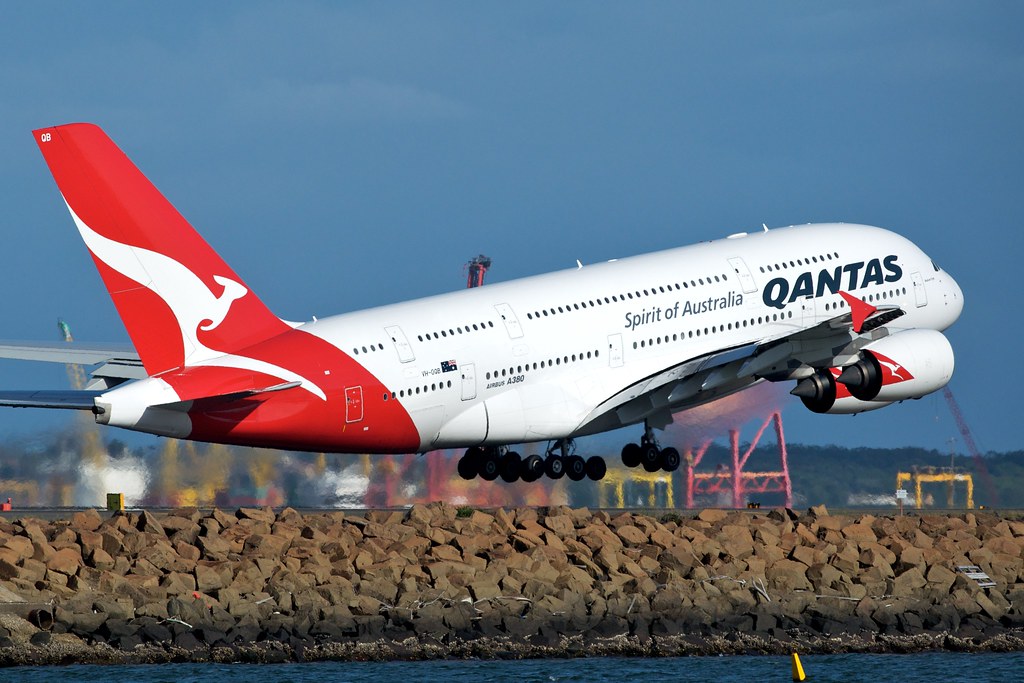 Photo: Qantas A380 VH-OQB | Departing SYD Wikipedia: en.wikipedia.o… | Flickr
Fleet Composition and Opportunities
Qantas’ long-haul fleet consists of the following aircraft types:
- Boeing 787-9: 13 in service, with four on order. Strong operational performance, though higher per-seat costs remain a concern.
- Airbus A330-300: 12 in service, highly cost-efficient and well amortized, ensuring strong financial returns.
- Airbus A380-800: 10 in service, facing competitive pressures from Emirates and Cathay Pacific.
- Boeing 787-10 and Airbus A350-1000: Expected future additions, poised to enhance long-haul efficiency and capacity.
The A380’s viability remains uncertain, with competitive pressures in high-yield markets such as Sydney-London and Sydney-Los Angeles.
The introduction of newer, fuel-efficient aircraft such as the A350-1000 is expected to optimize long-haul operations, ensuring better cost per seat while maintaining passenger comfort.
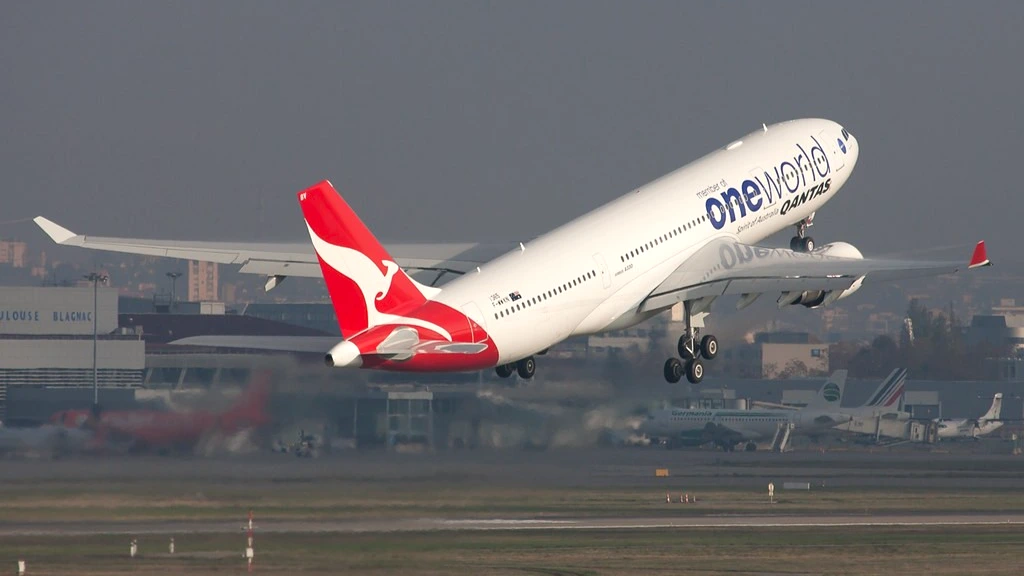 Photo: Clément Alloing
Methodology & Data Sources
The analysis utilizes two key indices:
- MOXI (Market Outlook & Expansion Index): Assesses passenger volume growth and market share trends.
- COFI (Commercial & Operational Fit Index): Evaluates the financial and operational performance of aircraft in the fleet.
Data sources include Milanamos for traffic and revenue data, and ch-aviation for fleet insights.
Stay tuned with us. Further, follow us on social media for the latest updates.
Join us on Telegram Group for the Latest Aviation Updates. Subsequently, follow us on Google News
Qantas Iconic ‘Kangaroo Route’ Revived with a Luxury Twist
The post Qantas Airways 30 Busiest Domestic and International Routes appeared first on Aviation A2Z.


![Zwrot w sprawie ataku w Brennej. 21-latek z zarzutami i w areszcie [NOWE FAKTY]](https://tvs.pl/wp-content/uploads/2026/06/policja__tvs_zajawka_2026.06.17-1-2.webp)