 4 miesięcy temu

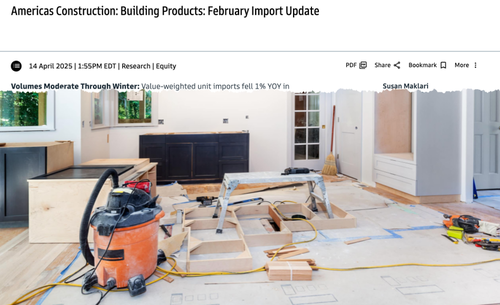
Attention Homeowners: Here’s Where Your Imported Home Goods Are Actually Made
Although President Trump rolled back some reciprocal tariffs last week (ex-China), U.S. imports still face an average effective tariff rate of 27%—the highest since 1903. These elevated duties, hitting just as the spring housing and remodeling season gets underway, complicate the sourcing of overseas building materials and home goods from high-tariff countries and may even force sourcing from low-tariff countries or even domestically.
Goldman analysts Susan Maklari, Charles Perron-Piche, and Rhea Bhatia cited United States International Trade Commission data to help clients understand where the most basic imported home goods and building materials were sourced from in 2024.
Maklari provided clients with a country-by-country breakdown of the top U.S. imports of home goods and building materials, including washers, dryers, water heaters, cabinets, vinyl tile, ceramic tile, carpets, lighting, mattresses, and lumber.
The note serves as a guide for identifying alternative sourcing options in countries with lower tariffs and a robust manufacturing base should these products be tariffed higher in top-producing countries at a cost-prohibitive rate:
Exhibit 9: Share of Washer Imports by Market (2024, in units)
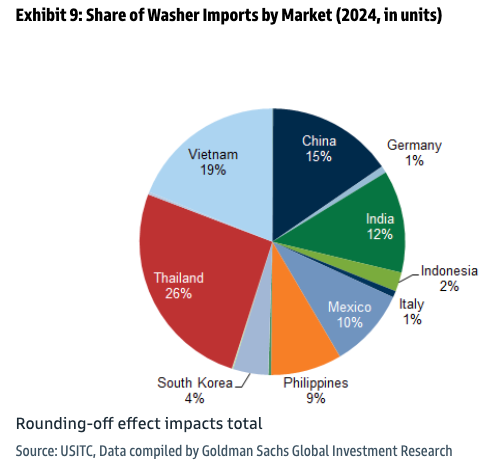
Exhibit 11: Share of Dryer Imports by Market (2024, in units)

Exhibit 13: Share of Electric Tank Water Heater Imports by Market (2024, in units)
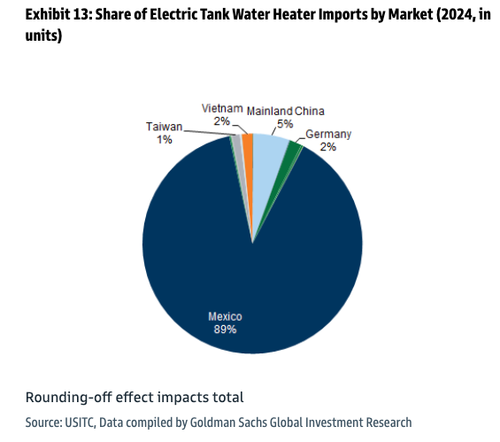
Exhibit 15: Share of Electric Tankless Water Heater Imports by Market (2024, in units)
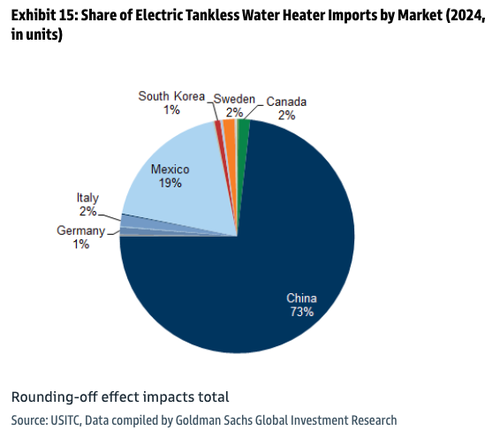
Exhibit 17: Share of Gas Tank Water Heater Imports by Market (2024, in units)
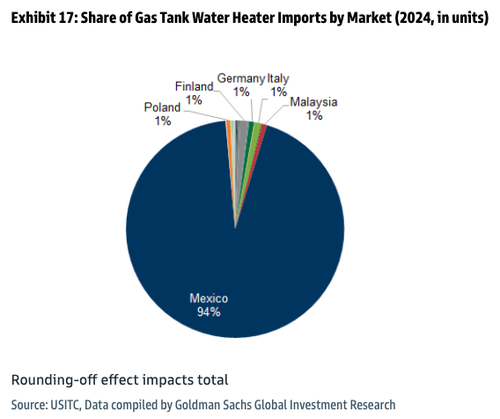
Exhibit 19: Share of Gas Tankless Water Heater Imports by Market (2024, in units)
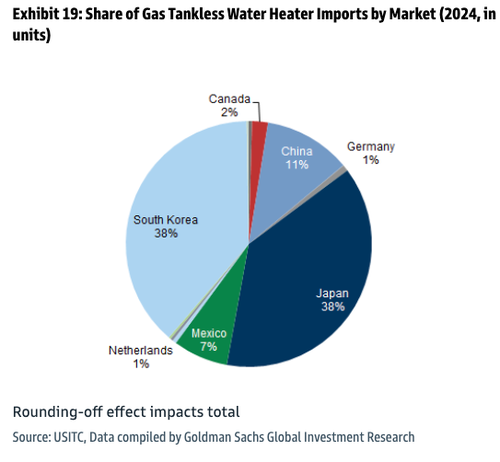
Exhibit 21: Share of Cabinet Imports by Market (2024, in units)
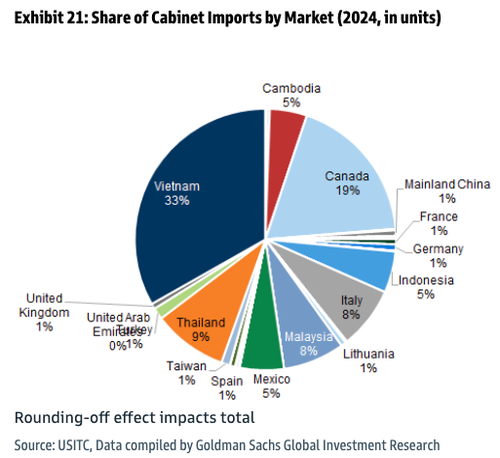
Exhibit 23: Share of Vinyl Tile Imports by Market (2024, in units)
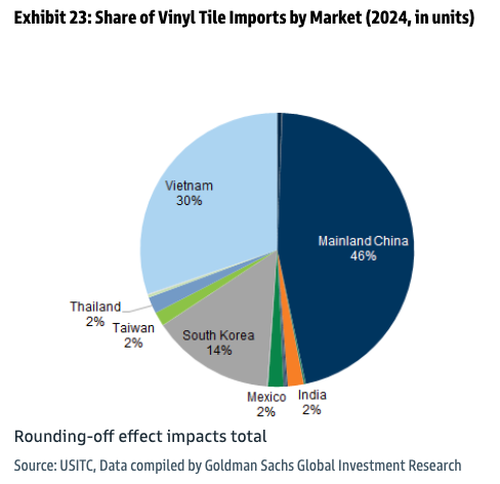
Exhibit 25: Share of Ceramic Tile Imports by Market (2024, in units)
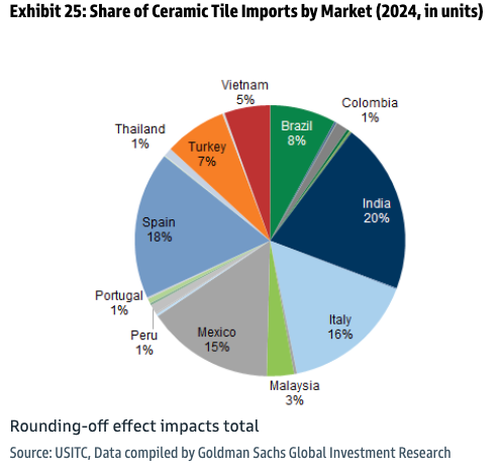
Exhibit 27: Share of Carpet Imports by Market (2024, in units)
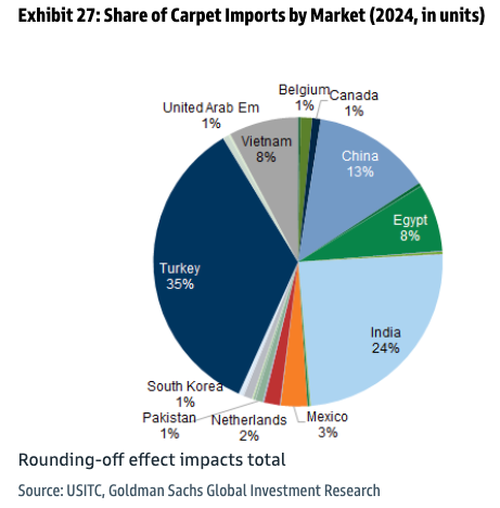
Exhibit 29: Share of Lighting Fixture Imports by Market (2024, in units)
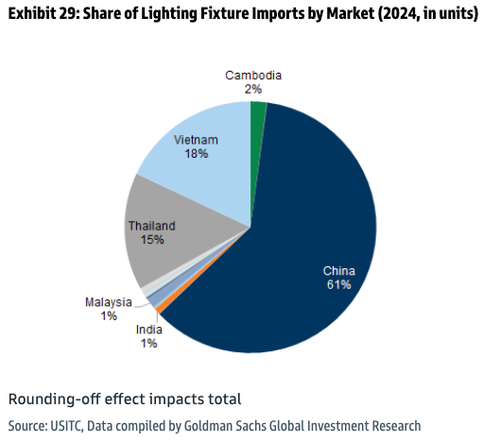
Exhibit 31: Share of Mattress Imports by Market (2024, in units)
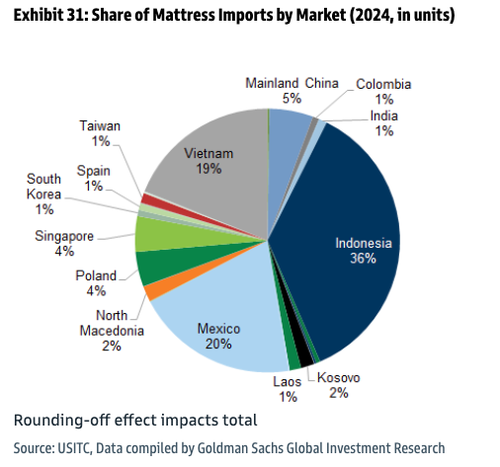
Exhibit 33: Share of Nonwoven Glass Imports by Market (2024, in units)
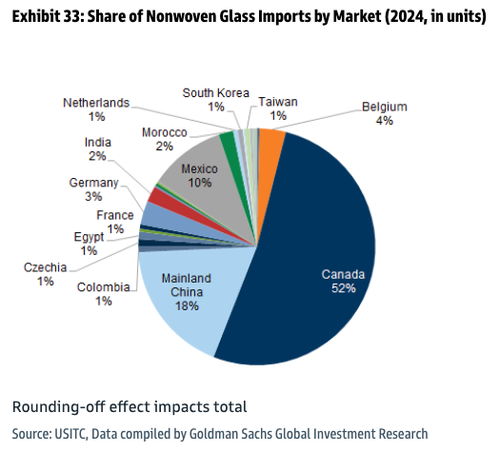
Exhibit 35: Share of Framing Lumber Imports by Market (2024, in units)

Exhibit 37: Share of OSB Imports by Market (2024, in units)
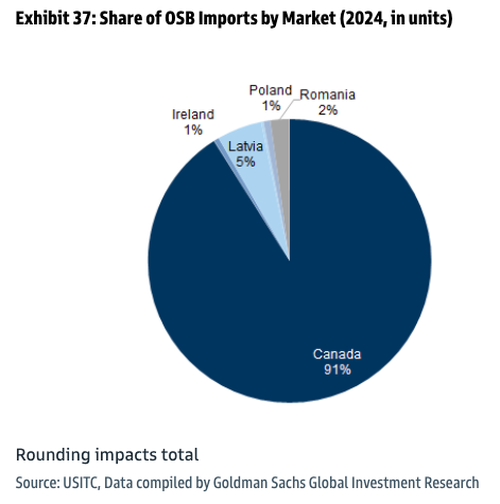
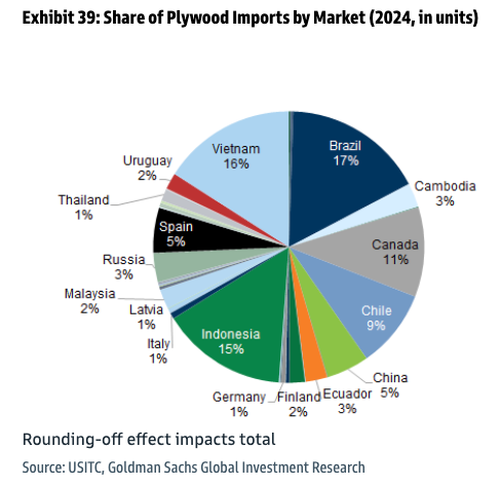
Exhibit 39: Share of Plywood Imports by Market (2024, in units)
We wouldn’t even be having this conversation if America had a robust manufacturing base capable of producing even the most basic home goods. Time to re-shore some of these supply chains.
Tyler Durden
Wed, 04/16/2025 – 07:45